Results module tutorial
This tutorial shows how to use the results function to generate figures based on the classification results obtained after training a ML model.
Importing modules:
import sys
import numpy as np
from pmtool.GenerateResultBox import GenerateResultBox
Generating a random dataset for test purpose representing train and test 'true' labels as well as 'predictions from some model' on test and external test sets:
train_labels = [int(np.round(np.random.uniform(low=0, high=1))) for i in range(100)]
train_predictions = [np.random.uniform(low=0, high=1) for i in range(100)]
test_labels = [int(np.round(np.random.uniform(low=0, high=1))) for i in range(50)]
test_predictions = [np.random.uniform(low=0, high=1) for i in range(50)]
external_labels = [int(np.round(np.random.uniform(low=0, high=1))) for i in range(50)]
external_predictions = [np.random.uniform(low=0, high=1) for i in range(50)]
Creating the result generation object:
result_generation = GenerateResultBox(train_labels=train_labels,
                                      train_predictions=train_predictions,
                                      test_labels=test_labels,
                                      test_predictions=test_predictions,
                                      external_labels=external_labels,
                                      external_predictions=external_predictions)
Exploring the scores on train set:
result_generation.get_results("train")
| auc | balanced accuracy | precision | recall | f1 score | |
|---|---|---|---|---|---|
| train | 0.427173 | 0.522236 | 0.587302 | 0.649123 | 0.616667 |
Printing out the scores with confidence intervals (CI) for the train, test, and external test sets:
result_generation.get_stats_with_ci("train")
| auc | balanced accuracy | precision | recall | f1 score | |
|---|---|---|---|---|---|
| train | 0.43 CI [0.31,0.54] | 0.52 CI [0.43,0.62] | 0.59 CI [0.47,0.71] | 0.65 CI [0.53,0.78] | 0.62 CI [0.51,0.71] |
result_generation.get_stats_with_ci("test")
| auc | balanced accuracy | precision | recall | f1 score | |
|---|---|---|---|---|---|
| test | 0.55 CI [0.38,0.71] | 0.52 CI [0.39,0.64] | 0.56 CI [0.40,0.70] | 0.74 CI [0.56,0.90] | 0.63 CI [0.47,0.76] |
result_generation.get_stats_with_ci("external")
| auc | balanced accuracy | precision | recall | f1 score | |
|---|---|---|---|---|---|
| external | 0.46 CI [0.30,0.63] | 0.47 CI [0.38,0.57] | 0.43 CI [0.00,0.80] | 0.12 CI [0.00,0.26] | 0.18 CI [0.00,0.36] |
Testing different functionalities of the confusion matrix generation:
fig_train = result_generation.print_confusion_matrix("train",["0","1"])
Normalized confusion matrix
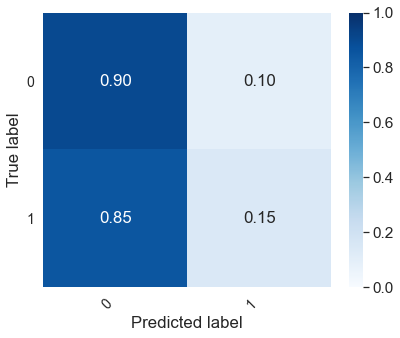
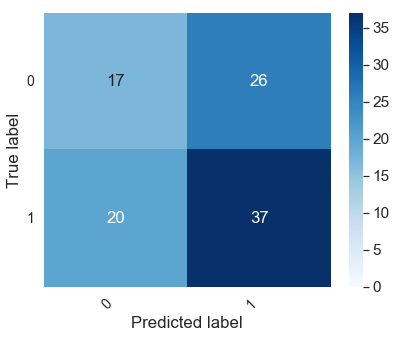
fig_train = result_generation.print_confusion_matrix("train",["0","1"],normalize=False)
Confusion matrix, without normalization

fig_train = result_generation.print_confusion_matrix("train",["0","1"],
                                                     normalize=False,
                                                     save_fig=True)
Confusion matrix, without normalization
Plotting the ROC curves on the 3 sets (train, test, external test):
result_generation.plot_roc_auc_ci(title ="testing roc curve function")
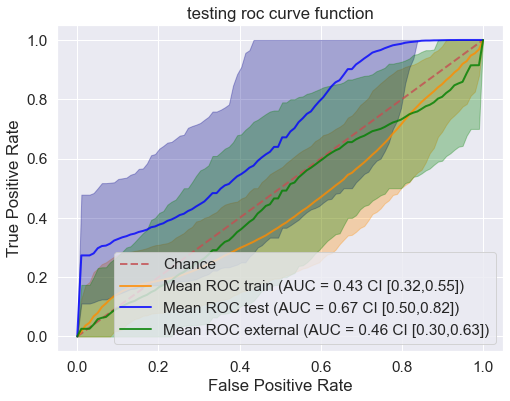
'testing roc curve function done'