precision-medicine-toolbox tutorials
The precision-medicine-toolbox functionality is illustrated in the following notebooks. You can clone the precision-medicine-toolbox repository to your computer and find the Jupyter files in the examples folder. The data folder is for imaging data. The scripts can be corrected accordingly.
Imaging module
How to explore the imaging parameters, perform basic quality check for the imaging data, convert DICOM into NRRD, perform basic image pre-processing, check ROI segmentation, and extract the radiomic features:
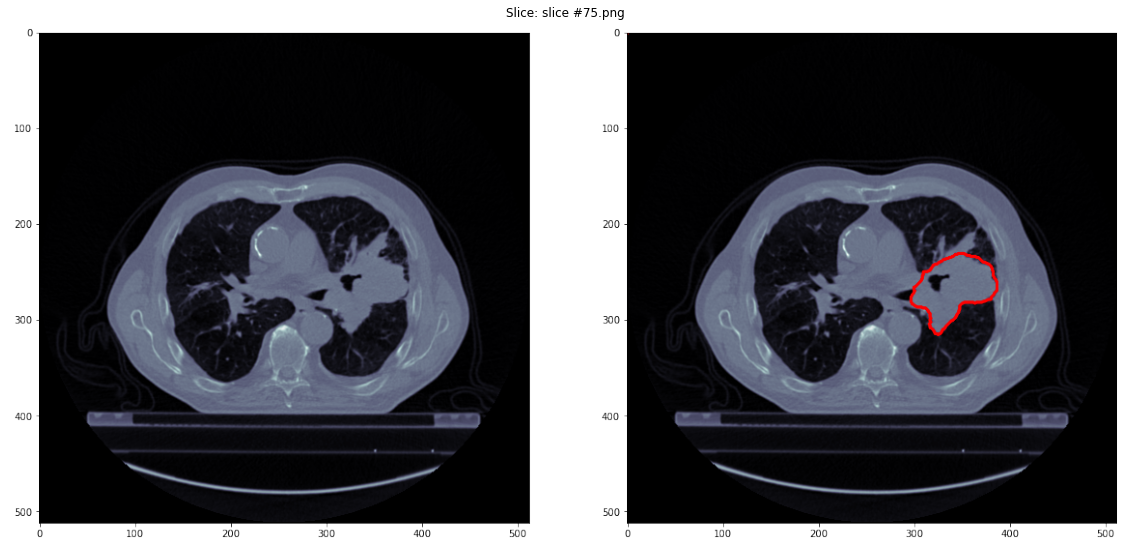
Example of mask alignment check:
Features module
How to visualize features distribution in classes, plot the feature correlation matrix, check Mann-Whitney U-test p-values, plot univariate ROC (and calculate AUC) for each feature, perform volumetric analysis, and save all the scores:
Exploratory feature analysis:
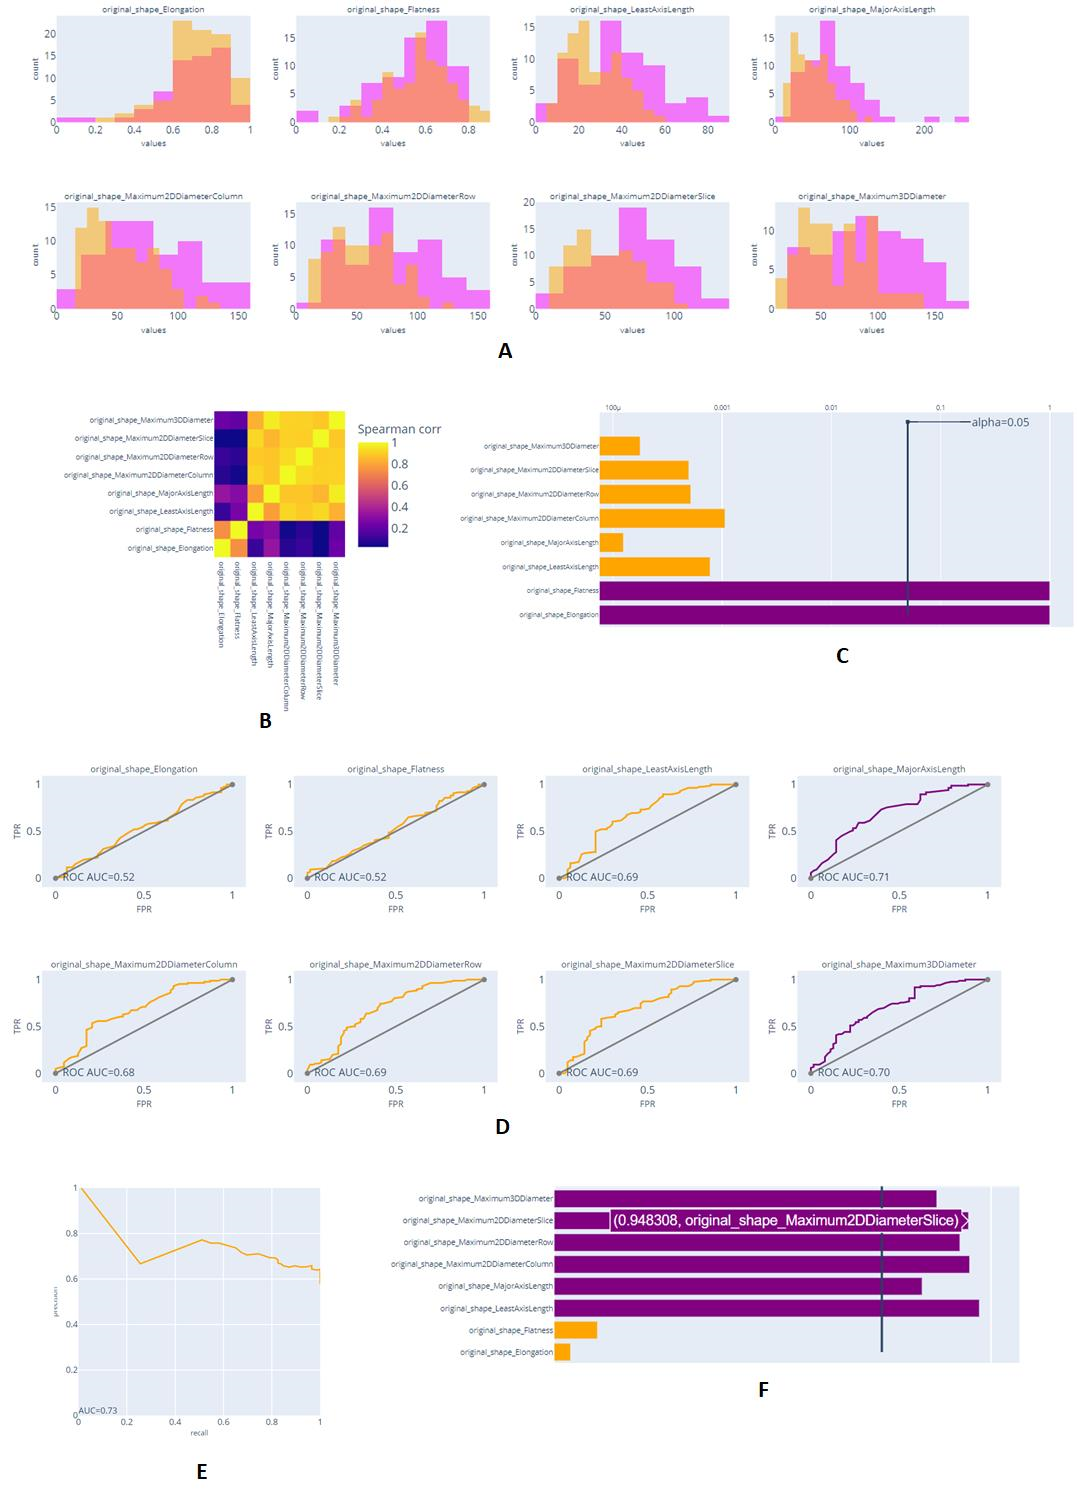
A - feature value distributions in binary classes, B - Spearman’s correlation matrix between features, C - Mann-Whitney test (Bonferroni corrected) p-values, D - univariate ROC curves for binary classification, E - volume based precision-recall curve, F - features Spearman's correlation with volume.
Results module
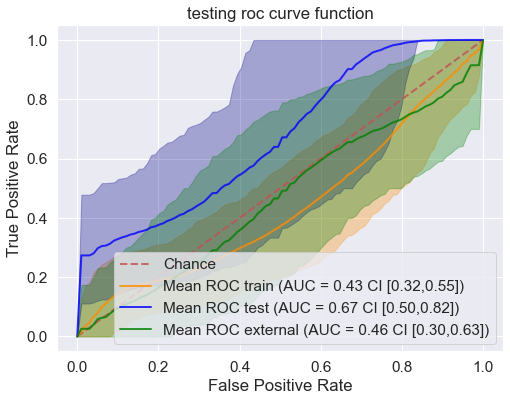
How to get the formatted classification metrics with confidence intervals, plot confusion matrices and ROC curves:
Example of the binary classification results presentation:
Suggestions
If you are feeling a feature is not illustrated in the tutorials above, don't hesitate to suggest/contribute.